Fourier Series#
GraphingLib components used: Figure
import graphinglib as gl
import numpy as np
from functools import partial
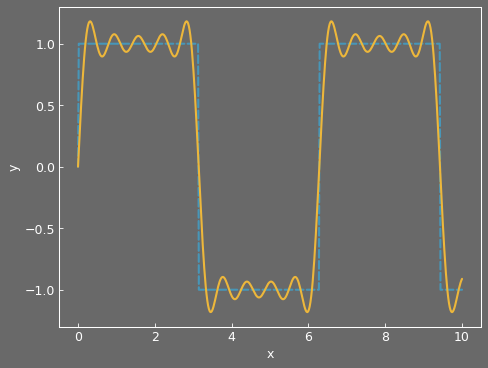
n_terms = 10
# Function to generate data for Fourier series visualization
def square_wave_fourier_series(x, n_terms):
y = np.zeros_like(x)
for n in range(1, n_terms + 1, 2):
y += (4 / (np.pi * n)) * np.sin(n * x)
return y
# Creating the Fourier series and the square wave
series = gl.Curve.from_function(
func=partial(square_wave_fourier_series, n_terms=n_terms), x_min=0, x_max=10
)
square_wave = gl.Curve.from_function(
func=lambda x: np.sign(np.sin(x)), x_min=0, x_max=10, line_style="--"
)
# Creating a figure with a dark style
fig = gl.Figure(
x_label="x",
y_label="y",
figure_style="dim",
)
fig.add_elements(square_wave, series)
fig.show()