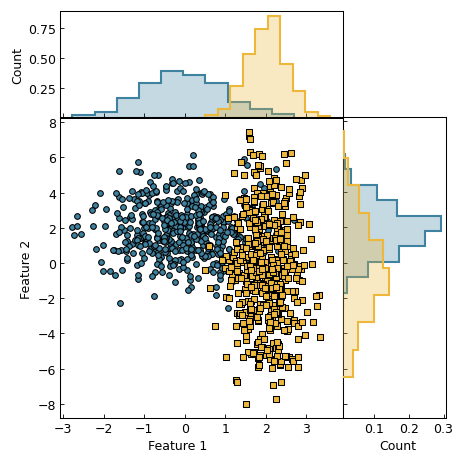
Histogram Distributions#
GraphingLib components used: Histogram, Scatter, SmartFigure, get_colors()
import numpy as np
import graphinglib as gl

np.random.seed(0)

distribution_1 = gl.Scatter(
    np.random.normal(loc=0, scale=1, size=500),
    np.random.normal(loc=2, scale=1.5, size=500),
    edge_color="black",
    marker_size=30,
    marker_edge_width=1,
)

distribution_2 = gl.Scatter(
    np.random.normal(loc=2, scale=0.5, size=500),
    np.random.normal(loc=-0.4, scale=3, size=500),
    edge_color="black",
    marker_size=30,
    marker_edge_width=1,
    marker_style="s",
)

colors = gl.get_colors()
vertical_histograms = [
    gl.Histogram(
        distribution_1.x_data, bins=10, face_color=colors[0], edge_color=colors[0]
    ),
    gl.Histogram(
        distribution_2.x_data, bins=10, face_color=colors[1], edge_color=colors[1]
    ),
]
horizontal_histograms = [
    gl.Histogram(
        distribution_1.y_data,
        bins=10,
        face_color=colors[0],
        edge_color=colors[0],
        orientation="horizontal",
    ),
    gl.Histogram(
        distribution_2.y_data,
        bins=10,
        face_color=colors[1],
        edge_color=colors[1],
        orientation="horizontal",
    ),
]

# Create two column figures: one which shares the x_axis to perfectly align the histograms, and a second for the
# horizontal histograms
col_1_fig = gl.SmartFigure(  # left column figure
    num_rows=2,
    num_cols=1,
    x_label="Feature 1",
    sub_y_labels=["Count", "Feature 2"],
    y_lim=[
        (0.01, None)
    ],  # Remove the bottom tick (0) of the top plot to avoid overlap with the histogram
    share_x=True,
    height_padding=0,
    height_ratios=[1, 3],
    reference_labels=False,
    elements=[vertical_histograms, [distribution_1, distribution_2]],
)

col_2_fig = gl.SmartFigure(  # right column figure
    num_rows=2,
    num_cols=1,
    x_label="Count",
    x_lim=(
        0.01,
        None,
    ),  # Remove the left tick (0) of the bottom plot to avoid overlap with the histogram
    height_padding=0,
    height_ratios=[1, 3],
    reference_labels=False,
    elements=[None, horizontal_histograms],
).set_tick_params(draw_left_labels=False)

fig = gl.SmartFigure(
    num_rows=1,
    num_cols=2,
    size=(6, 6),
    width_padding=0,
    width_ratios=[3, 1],
    general_legend=True,  # Collect all legends from sub-figures
    show_legend=False,  # but hide this collected legend
    elements=[col_1_fig, col_2_fig],
).show()