Projections#
GraphingLib components used: Curve, Scatter, SmartFigure
import numpy as np
import graphinglib as gl
np.random.seed(0)
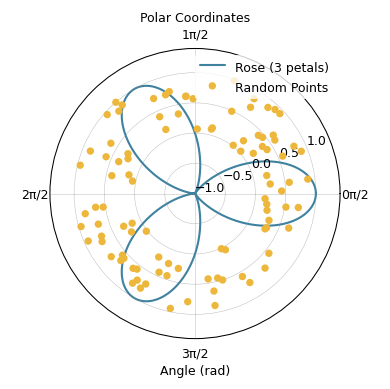
# Polar plot: rose curve
theta = np.linspace(0, 2 * np.pi, 1000)
r = np.cos(3 * theta)
polar_curve = gl.Curve(theta, r, label="Rose (3 petals)")
# Polar scatter: random points in polar coordinates
theta_scatter = np.random.uniform(0, 2 * np.pi, 100)
r_scatter = np.random.uniform(0, 1, 100)
polar_scatter = gl.Scatter(
theta_scatter, r_scatter, label="Random Points", face_color="C1"
)
# Create a figure with polar and cartesian projections
polar_fig = (
gl.SmartFigure(
size=(5, 5),
y_lim=(-1, 1.4), # y in a polar plot corresponds to r
aspect_ratio=1,
projection=["polar"],
x_label="Angle (rad)",
title="Polar Coordinates",
elements=[polar_curve, polar_scatter],
)
.set_ticks(
x_ticks=[0, np.pi / 2, np.pi, 3 * np.pi / 2],
x_tick_labels=lambda x: f"{x / (np.pi / 2):.0f}π/2",
y_tick_spacing=0.5,
)
.set_tick_params(direction="out")
)
polar_fig.show()