Matplotlib Plottables#
GraphingLib components used: PlottableAxMethod, SmartFigure
import numpy as np
import graphinglib as gl
np.random.seed(0)
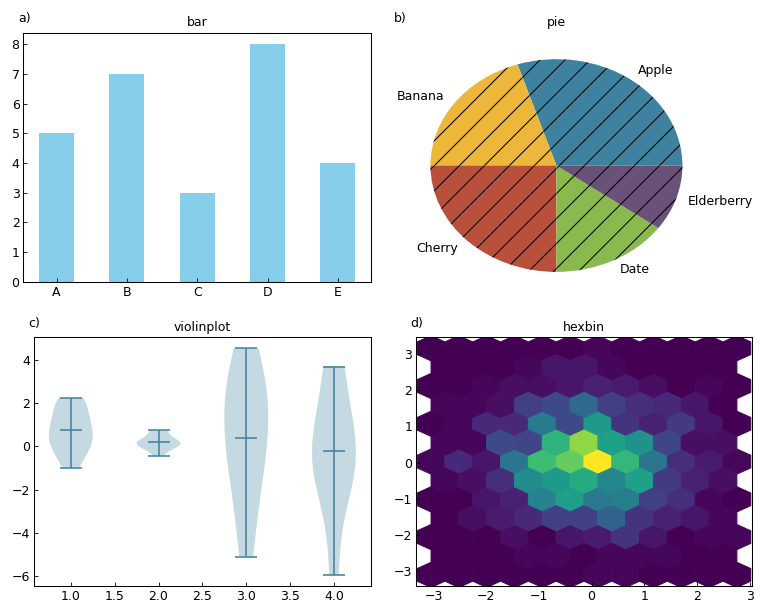
# Create matplotlib plottables that aren't supported yet in GraphingLib
bar = gl.PlottableAxMethod(
meth="bar",
x=[1, 2, 3, 4, 5],
height=[5, 7, 3, 8, 4],
width=0.5,
color="skyblue",
tick_label=["A", "B", "C", "D", "E"],
)
pie = gl.PlottableAxMethod(
meth="pie",
x=[30, 20, 25, 15, 10],
labels=["Apple", "Banana", "Cherry", "Date", "Elderberry"],
hatch="/",
)
violin = gl.PlottableAxMethod(
meth="violinplot",
dataset=[np.random.normal(0, stddev, 10) for stddev in [1, 0.5, 2, 3]],
positions=[1, 2, 3, 4],
showmeans=True,
)
hexbin = gl.PlottableAxMethod(
meth="hexbin",
x=np.random.normal(0, 1, 1000),
y=np.random.normal(0, 1, 1000),
gridsize=11,
)
elements = [bar, pie, violin, hexbin]
fig = gl.SmartFigure(
num_rows=2,
num_cols=2,
subtitles=[e.meth for e in elements],
elements=elements,
size=(10, 8),
).show()