Heatmap With Custom Mesh#
GraphingLib components used: Figure, Heatmap
import numpy as np
import graphinglib as gl
# Create data on a non-uniform grid with logarithmic spacing
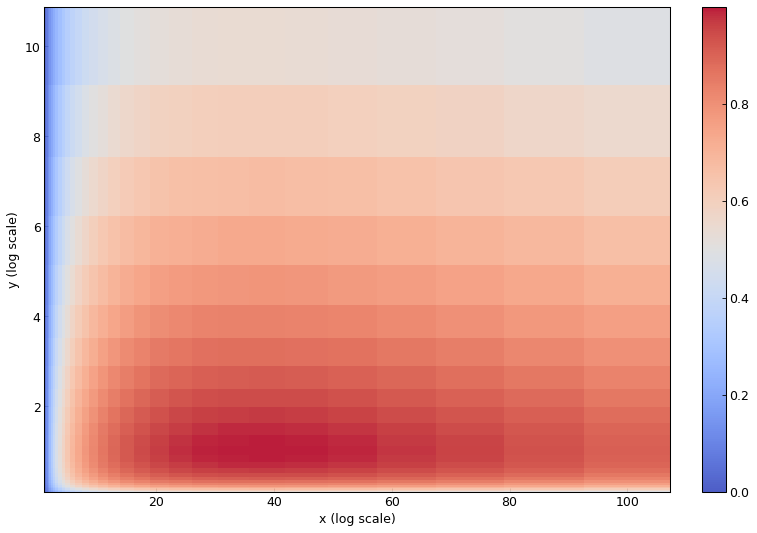
x_nonuniform = np.logspace(0, 2, 30) # Log-spaced: 1 to 100
y_nonuniform = np.logspace(-1, 1, 25) # Log-spaced: 0.1 to 10
# Create mesh grids
x_mesh, y_mesh = np.meshgrid(x_nonuniform, y_nonuniform)
# Create some sample data
z_data = np.sin(np.log10(x_mesh)) * np.cos(np.log10(y_mesh))
# Create heatmap with custom mesh (uses pcolormesh internally)
heatmap = gl.Heatmap(
image=z_data,
x_mesh=x_mesh,
y_mesh=y_mesh,
color_map="coolwarm",
show_color_bar=True,
alpha=0.9,
)
fig = gl.Figure(size=(10, 7), x_label="x (log scale)", y_label="y (log scale)")
fig.add_elements(heatmap)
fig.show()