Specialized SmartFigures for different projections#
Specialized SmartFigure classes are available to handle specific projection needs. These classes extend the functionality of the standard SmartFigure to provide features tailored to particular types of data and coordinate systems. Currently, only the SmartFigureWCS class is implemented, which is designed for astronomical data using the World Coordinate System (WCS).
Plotting Astronomical Data with SmartFigureWCS#
The SmartFigureWCS class is a specialized version of the SmartFigure class designed specifically for astronomical data using the World Coordinate System (WCS) from Astropy.
Note
SmartFigureWCS is only available when you install the optional astro extra. Install with pip install graphinglib[astro] to enable WCS features.
Introduction to WCS#
The World Coordinate System is a Flexible Image Transport System (FITS) standard used in astronomy to describe the mapping between pixel coordinates in an image and physical coordinates on the sky (typically right ascension and declination). WCS is essential for:
Displaying astronomical images with proper coordinate labels
Overlaying data from different instruments or observations
Converting between pixel and sky coordinates
Aligning and comparing multi-wavelength observations
Creating publication-quality astronomical figures
WCS metadata is typically stored in FITS file headers and includes information about:
Reference pixel positions (
CRPIX)Reference coordinate values (
CRVAL)Coordinate increments per pixel (
CDELTorCDmatrix)Projection type (
CTYPE, e.g.,"RA---TAN","DEC--TAN")Rotation and distortion parameters
Key Differences from SmartFigure#
SmartFigureWCS extends SmartFigure with several important differences:
Required WCS Projection#
The projection parameter is required and must be an astropy.wcs.WCS object. This ensures proper handling of astronomical coordinate systems. Since it is no longer optional, the projection argument is now the first positional argument in the constructor.
Specialized Tick Handling#
The SmartFigureWCS uses astropy.visualization.wcsaxes which provide:
Automatic formatting of celestial coordinates (RA/Dec, Galactic, etc.)
Sexagesimal notation for right ascension and declination
Coordinate grid lines that follow great circles on the sky
Enhanced Coordinate Grids#
SmartFigureWCS provides enhanced support for coordinate grids appropriate for astronomical data:
Grid lines follow the curved coordinate system
Proper handling of coordinate system boundaries
Support for different coordinate frames (ICRS, Galactic, Ecliptic, etc.)
All Standard Features Available#
Despite these specializations, SmartFigureWCS supports all features of SmartFigure:
Multiple subplots and nesting
Twin axes
Custom styling and themes
Reference labels
Legends and annotations
All customization methods (
set_visual_params(),set_tick_params(), etc.)
Note
You can also nest SmartFigureWCS objects within standard SmartFigure layouts or vice versa to combine plots with different projections. Indexing follows the same rules as for SmartFigure, so retrieving fig[0, 0] returns the child SmartFigure occupying that position.
Getting Started#
Loading FITS Files#
The most common workflow involves loading a FITS file that contains WCS information:
from astropy.io import fits
from astropy.wcs import WCS
import graphinglib as gl

# Load FITS file
hdu = fits.open('astronomical_image.fits')[0]

# Extract WCS from header
wcs = WCS(hdu.header)

# Create heatmap from data
heatmap = gl.Heatmap(hdu.data, origin_position="lower")

# Create figure with WCS projection
fig = gl.SmartFigureWCS(
    projection=wcs,
    title="Astronomical Image",
    elements=heatmap
)
Note
The origin_position="lower" argument in Heatmap is necessary because WCSAxes do not support images with origin="upper".
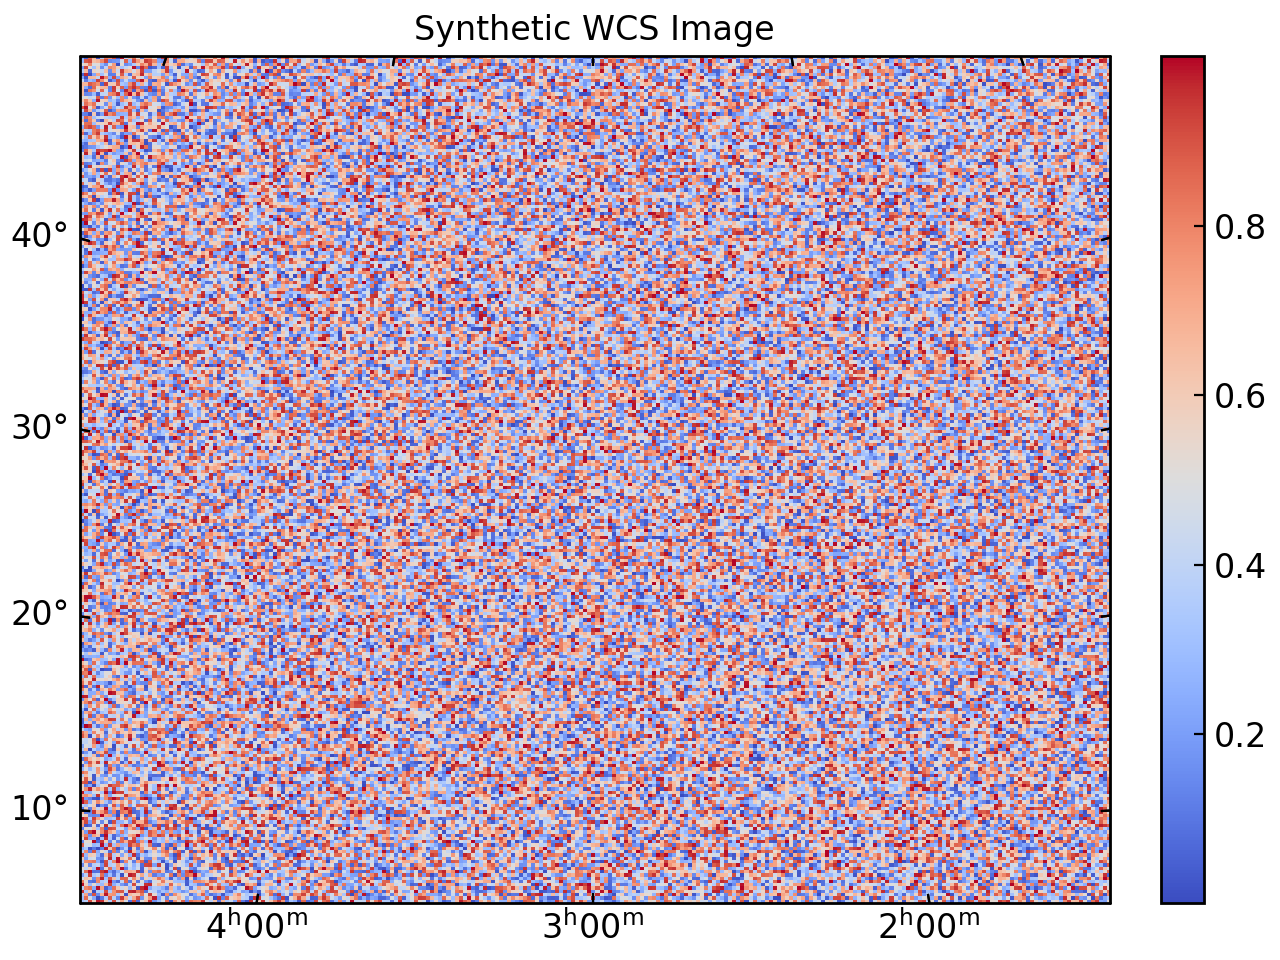
Creating WCS Objects Programmatically#
For testing or custom coordinate systems, you can create WCS objects programmatically:
from astropy.wcs import WCS
import numpy as np
import graphinglib as gl

# Create a simple WCS for a tangent plane projection
wcs = WCS(naxis=2)
wcs.wcs.crpix = [128, 128]           # Reference pixel (center)
wcs.wcs.crval = [45.0, 30.0]         # RA, Dec at reference pixel (degrees)
wcs.wcs.cdelt = [-0.2, 0.2]      # Pixel scale (degrees/pixel)
wcs.wcs.ctype = ["RA---TAN", "DEC--TAN"]  # Gnomonic projection

# Create synthetic data
data = np.random.rand(256, 256)
heatmap = gl.Heatmap(data, origin_position="lower")

# Plot with WCS
fig = gl.SmartFigureWCS(
    projection=wcs,
    title="Synthetic WCS Image",
    elements=heatmap
)
fig.show()
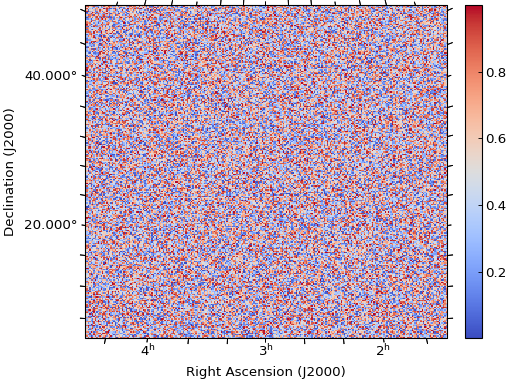
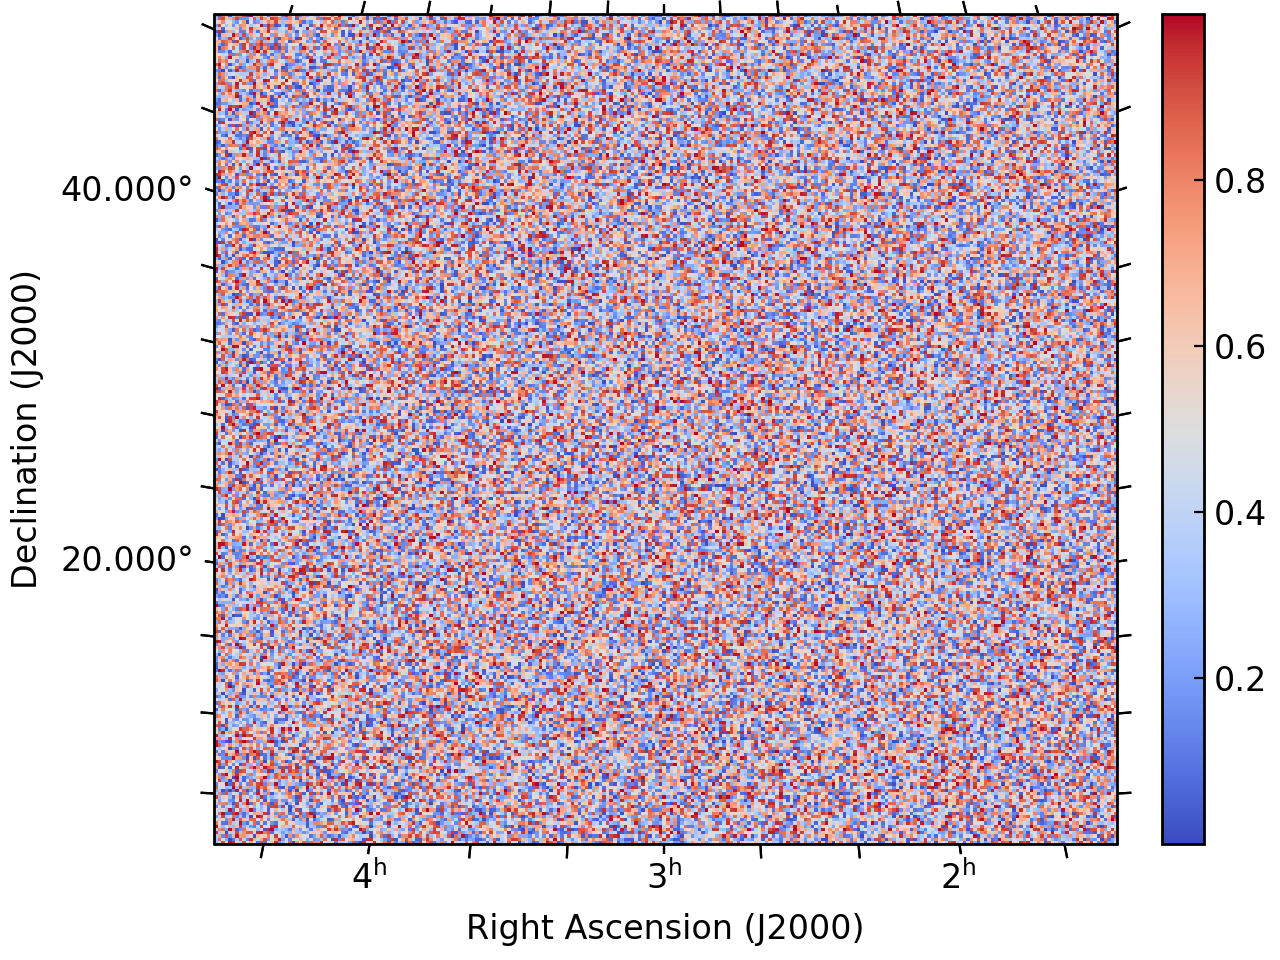
Customization#
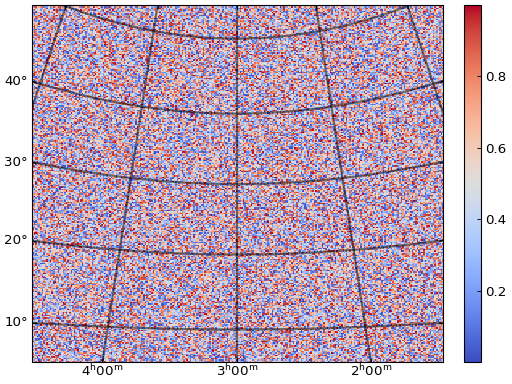
Customizing Coordinate Display#
Control how coordinates are displayed:
fig = gl.SmartFigureWCS(
    projection=wcs,
    x_label="Right Ascension (J2000)",
    y_label="Declination (J2000)",
    elements=heatmap
)

# Customize ticks
fig.set_ticks(
    number_of_y_ticks=2,  # approximate number of ticks (see docstring)
    x_tick_formatter="hh",
    y_tick_formatter="d.ddd",
    minor_x_tick_frequency=3,
    minor_y_tick_frequency=5
)

fig.set_tick_params(
    direction="out",
    minor_length=5
)

fig.show()

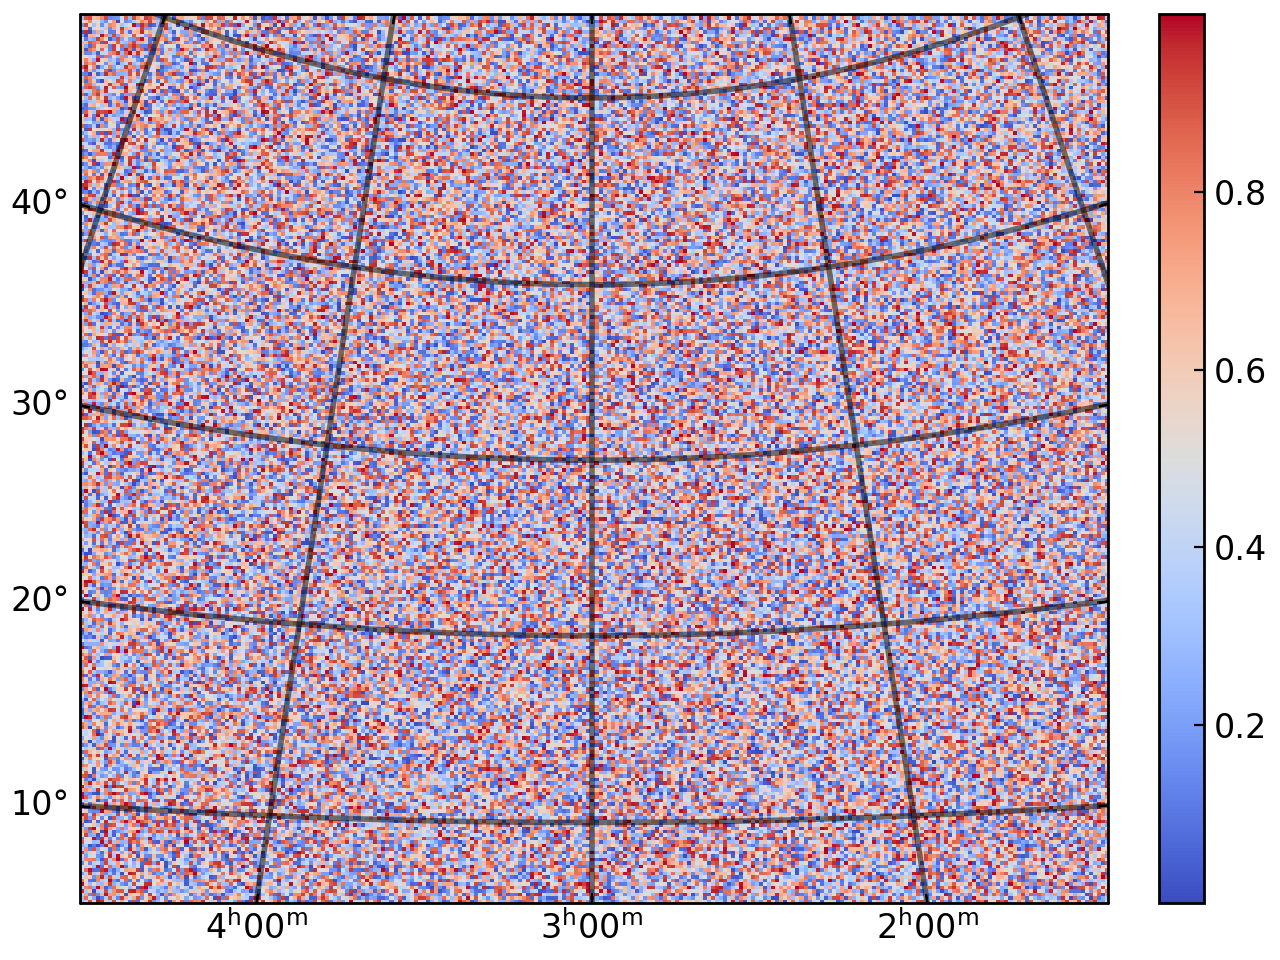
Adding Coordinate Grids#
WCS coordinate grids follow the curved coordinate system:
fig = gl.SmartFigureWCS(projection=wcs, elements=heatmap)

# Add coordinate grid
fig.set_grid(
    color="black",
    line_width=2
)

fig.show()

Advanced Usage#
Multiple Subplots#
All subplots can share the same WCS projection:
# Load multiple observations
hdu1 = fits.open('observation1.fits')[0]
hdu2 = fits.open('observation2.fits')[0]
hdu3 = fits.open('observation3.fits')[0]
hdu4 = fits.open('observation4.fits')[0]

wcs = WCS(hdu1.header)  # Assuming same WCS for all

# Create heatmaps
heatmap1 = gl.Heatmap(hdu1.data, origin_position="lower")
heatmap2 = gl.Heatmap(hdu2.data, origin_position="lower")
heatmap3 = gl.Heatmap(hdu3.data, origin_position="lower")
heatmap4 = gl.Heatmap(hdu4.data, origin_position="lower")

# Create multi-panel figure
fig = gl.SmartFigureWCS(
    projection=wcs,
    num_rows=2,
    num_cols=2,
    subtitles=["Filter A", "Filter B", "Filter C", "Filter D"],
    elements=[heatmap1, heatmap2, heatmap3, heatmap4]
)
Similar to the SmartFigure, you can also specify different WCS projections using a list of WCS objects for the projection parameter. However, WCS projections must be given for every subfigure drawn by the SmartFigure, i.e. the length of the projection list must match the number of subfigures that will actually be drawn (see the __len__() method for more details):
wcs_list = [wcs1, wcs2]  # List of WCS objects for each subplot

fig = gl.SmartFigureWCS(
    projection=wcs_list,
    num_cols=2,
    elements=[heatmap1, heatmap2]
)
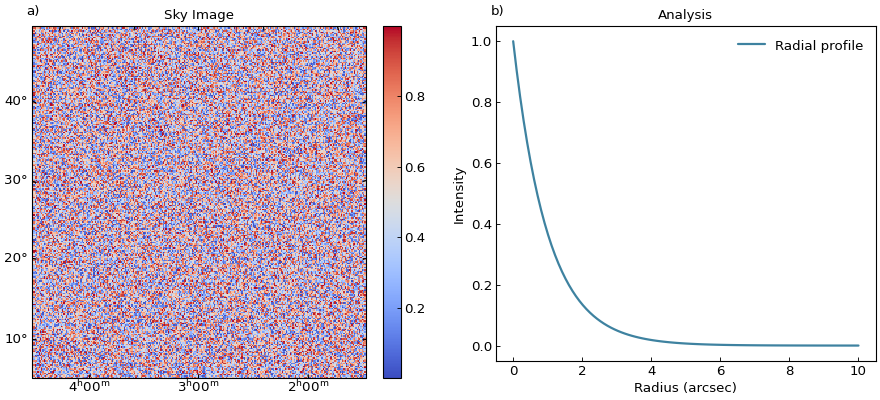
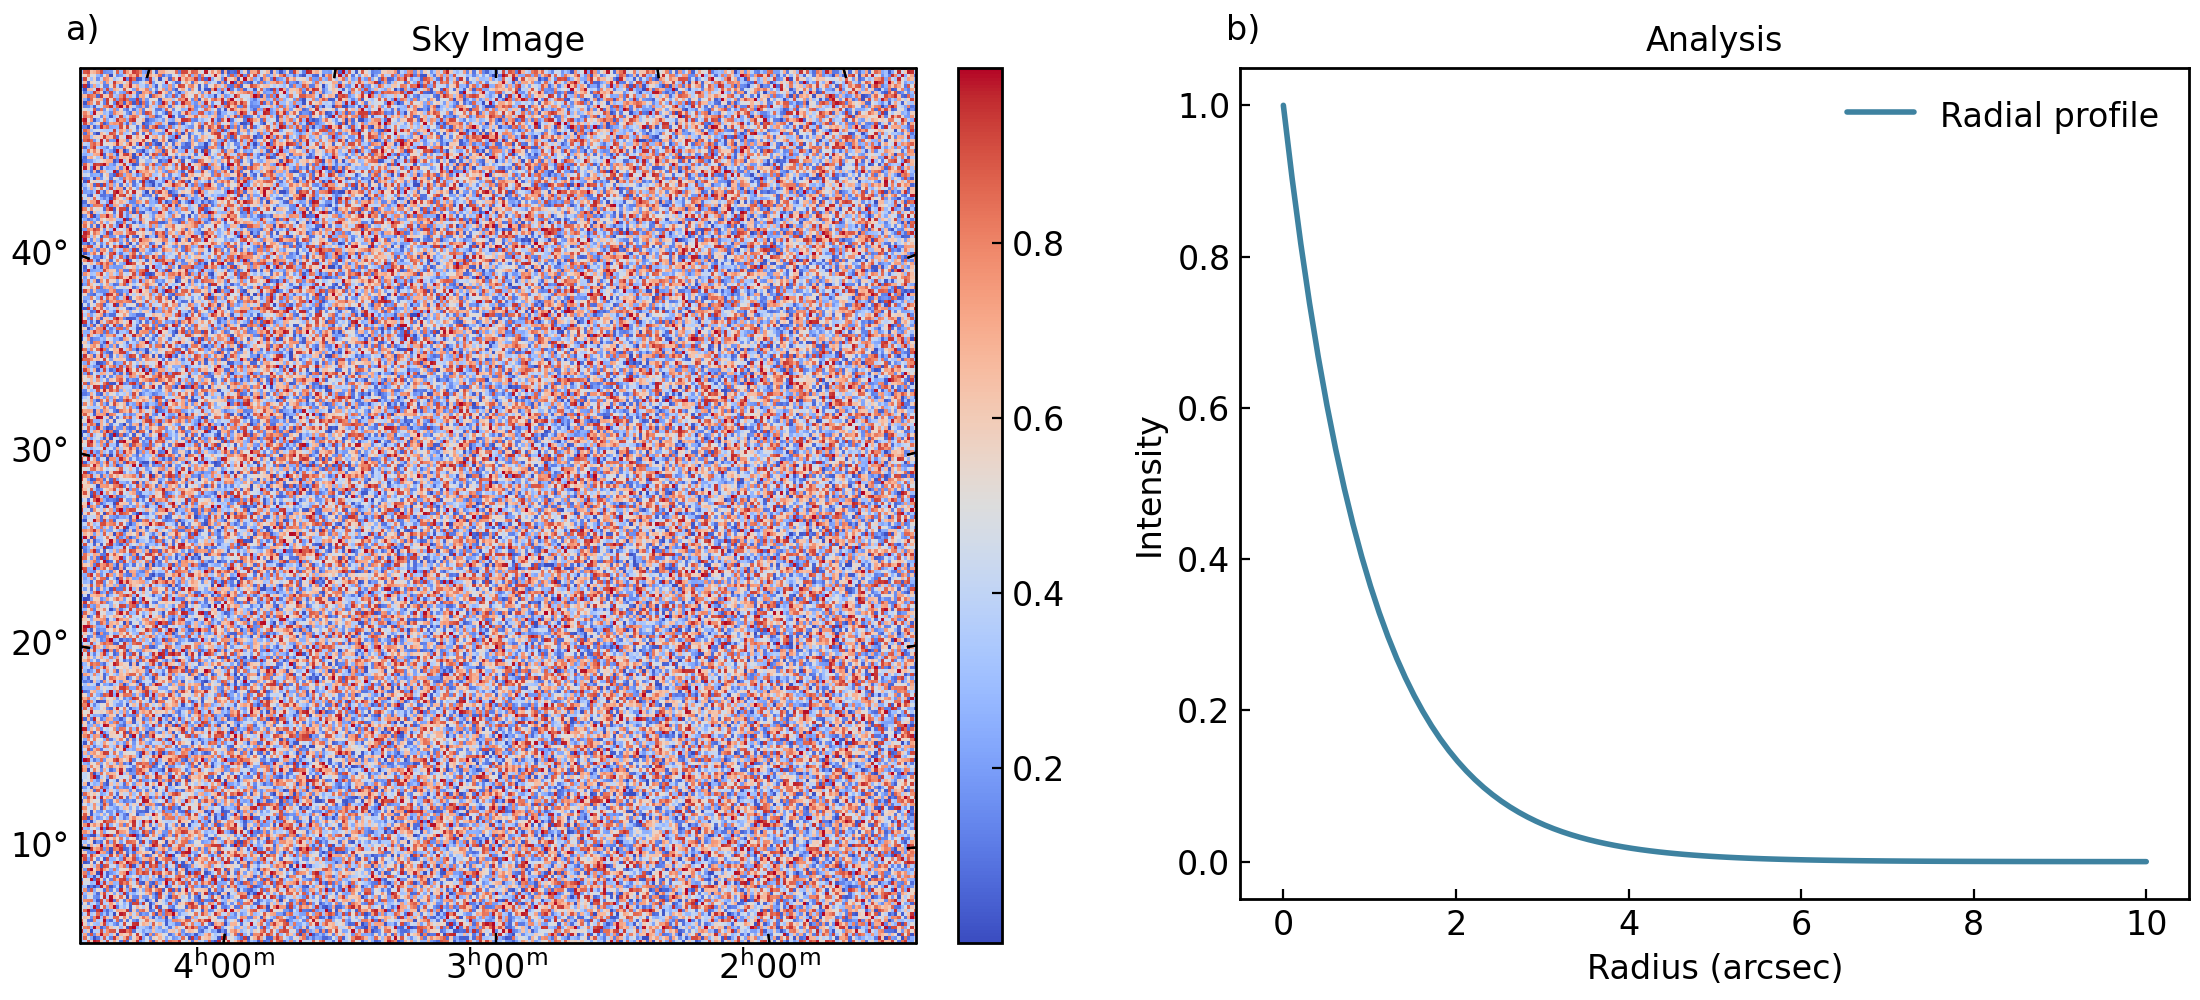
Nesting WCS Figures#
Combine WCS figures with standard figures:
# Create WCS figure
wcs_fig = gl.SmartFigureWCS(
    projection=wcs,
    title="Sky Image",
    elements=heatmap
)

# Create standard analysis plots
x = np.linspace(0, 10, 100)
profile = gl.Curve(x, np.exp(-x), label="Radial profile")

analysis_fig = gl.SmartFigure(
    title="Analysis",
    x_label="Radius (arcsec)",
    y_label="Intensity",
    elements=profile
)

# Combine them
parent = gl.SmartFigure(
    num_cols=2,
    size=(11, 5),
    elements=[wcs_fig, analysis_fig]
)
parent.show()

Troubleshooting#
Common Issues#
- WCS not recognized
Ensure Astropy is installed and the FITS header contains valid WCS keywords.
- Incorrect coordinate labels
Check that
CTYPEkeywords in the FITS header are correctly set (e.g.,RA---TAN,DEC--TAN).- Coordinate grid not showing
Call
set_grid()to enable the grid, and ensure WCS that it is shown on top of the data.- Pixel-coordinate mismatch
FITS uses 1-based indexing, while Python/NumPy uses 0-based. Astropy handles this automatically, but be aware when doing manual calculations.
- Distorted images
Check the
CDELTorCDmatrix values. Very different values in x and y can cause distortion. Useaspect_ratio="equal"if needed.
Getting Help#
Astropy WCS documentation: https://docs.astropy.org/en/stable/wcs/
WCSAxes documentation: https://docs.astropy.org/en/stable/visualization/wcsaxes/
FITS WCS standard: https://fits.gsfc.nasa.gov/fits_wcs.html
GraphingLib issues: GraphingLib/GraphingLib#issues
See Also#
Creating a simple figure with the SmartFigure - Basic SmartFigure usage
Advanced SmartFigure Usage and Complete Reference - Advanced SmartFigure features
graphinglib.SmartFigureWCS - API reference